The following graphic of cigarettes smoked (sold) per capita (CIG) and deaths per 100K population from lung cancer (LUNG) indicates ___. 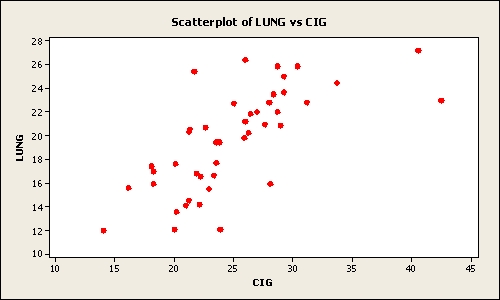
A) a weak relation between the two variables
B) a pretty strong relation between the two variables
C) when the number of cigarettes smoked (sold) per capita (CIG) increases the deaths per 100K population from lung cancer (LUNG) decreases
D) a negative relation between the two variables
E) no relation between the two variables
Correct Answer:
Verified
Q85: The following graphic of residential housing data
Q86: The total energy consumption (in kWh) for
Q87: The staff of Ms. Tamara Hill, VP
Q88: The staff of Mr. Wayne Wertz, VP
Q89: The staff of Ms. Tamara Hill, VP
Q90: The customer help center in your company
Q93: There are four majors in the School
Q94: The United Nations Development Programme website provides
Q95: The staff of Ms. Tamara Hill, VP
Q97: Consider a scatterplot showing the relationship between
Unlock this Answer For Free Now!
View this answer and more for free by performing one of the following actions

Scan the QR code to install the App and get 2 free unlocks

Unlock quizzes for free by uploading documents