The United Nations Development Programme website provides comparative data by country on key metrics. Two such metrics are life expectancy and expenditures on health as a percent of GDP. The table below shows data on life expectancy and health expenditures in the United States.  Which of the following scatterplots best depicts the relationship between life expectancy and expenditures on health as a percent of GDP?
A) 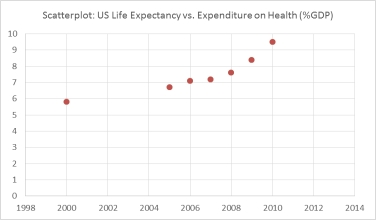
B) 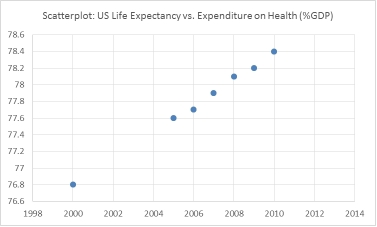
C) 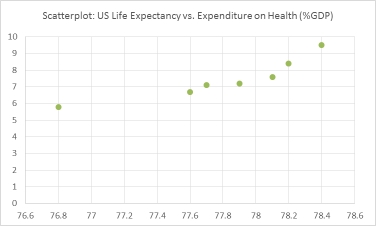
D) 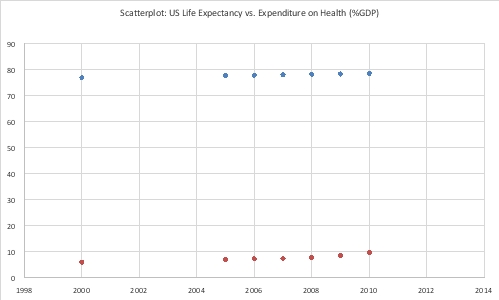
Correct Answer:
Verified
Q85: The following graphic of residential housing data
Q86: The total energy consumption (in kWh) for
Q87: The staff of Ms. Tamara Hill, VP
Q88: The staff of Mr. Wayne Wertz, VP
Q89: The staff of Ms. Tamara Hill, VP
Q90: The customer help center in your company
Q91: The following graphic of cigarettes smoked (sold)
Q93: There are four majors in the School
Q95: The staff of Ms. Tamara Hill, VP
Q97: Consider a scatterplot showing the relationship between
Unlock this Answer For Free Now!
View this answer and more for free by performing one of the following actions

Scan the QR code to install the App and get 2 free unlocks

Unlock quizzes for free by uploading documents