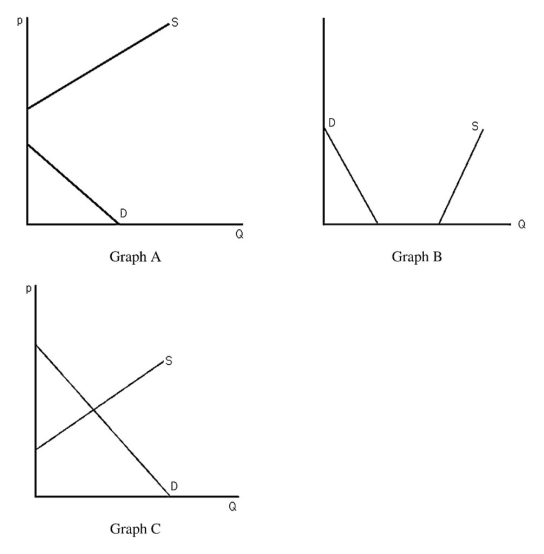
-The above figure shows three different supply-and-demand graphs.Which graph best represents the market for workers at your nearest fast-food restaurant?
A) Graph A
B) Graph B
C) Graph C
D) None of the above.
Correct Answer:
Verified
Q58: Technological innovation in the production of computers
Q59: If ethanol production is expected to increase
Q60: Suppose society wants to increase the number
Q61: At equilibrium,quantity sold equals the quantity bought.This
Q62: Use supply-and-demand graphs to explain why parking
Q64: If price is initially above the equilibrium
Q65: After tickets for a major sporting event
Unlock this Answer For Free Now!
View this answer and more for free by performing one of the following actions

Scan the QR code to install the App and get 2 free unlocks

Unlock quizzes for free by uploading documents