Multiple Choice

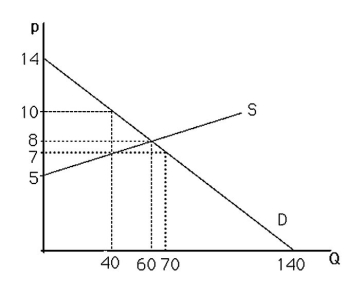
-The above figure shows a graph of the market for pizzas in a large town.At a price of $5,there will be
A) excess demand.
B) excess supply.
C) equilibrium.
D) zero demand.
Correct Answer:
Verified
Related Questions
Q61: At equilibrium,quantity sold equals the quantity bought.This
Q62: Use supply-and-demand graphs to explain why parking
Q63: Q64: If price is initially above the equilibrium Q65: After tickets for a major sporting event![]()

