Multiple Choice
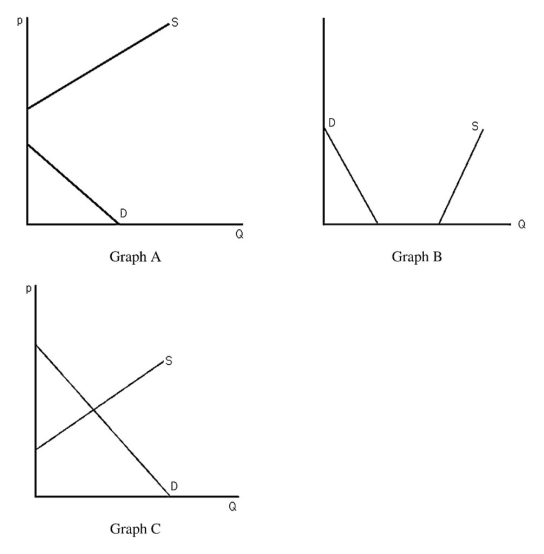
-The above figure shows three different supply-and-demand graphs.Which graph best represents the market for vacations on Mars?
A) Graph A
B) Graph B
C) Graph C
D) None of the above.
Correct Answer:
Verified
Related Questions
Q66: Q67: Q68: The supply and demand model assumes Q69: Q70: When a market is in disequilibrium consumers Q72: Q73: Lionfish is an aquatic invasive species in Q74: Suppose the market for potatoes can be Q75: A market equilibrium occurs Q76: Unlock this Answer For Free Now! View this answer and more for free by performing one of the following actions Scan the QR code to install the App and get 2 free unlocks Unlock quizzes for free by uploading documents![]()
![]()
A) no![]()
![]()
A) only with government![]()

