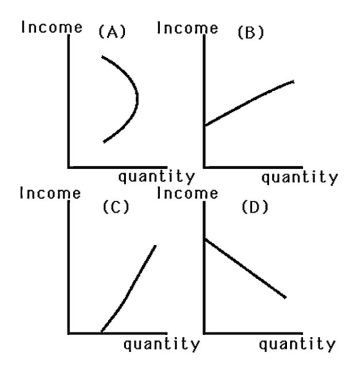
-Even though Mary's income is very low,she makes sure that she purchases enough milk for her family to drink.As her income rises,she does buy more milk.Which graph in the above figure best represents Mary's Engel curve for milk?
A) Graph A
B) Graph B
C) Graph C
D) Graph D
Correct Answer:
Verified
Q34: An increase in income (all else equal)will
Q35: Q36: Q37: Q38: Both Sally and Sam receive a 10% Q40: A movement upward along an upward sloping Q41: When the price of a good changes,the Q42: Suppose Lisa spends all of her money Q43: The substitution effect can be measured holding Q44: Unlock this Answer For Free Now! View this answer and more for free by performing one of the following actions Scan the QR code to install the App and get 2 free unlocks Unlock quizzes for free by uploading documents![]()
![]()
![]()
![]()

