Multiple Choice
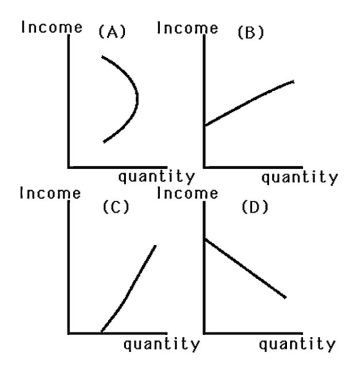
-When John was in college and his income was low,he drank "Red Ribbon" beer.As his income increased,he purchased better-quality beer and less "Red Ribbon." Which graph in the above figure best represents John's Engel curve for "Red Ribbon" beer?
A) Graph A
B) Graph B
C) Graph C
D) Graph D
Correct Answer:
Verified
Related Questions
Q31: Q32: Q33: If consumer income and prices increase by Q34: An increase in income (all else equal)will![]()
![]()

