Essay
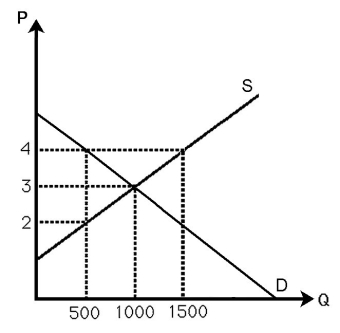
-The above figure shows the demand and supply curves in the market for milk.Currently,the market is in equilibrium.If the government imposes a $2 per gallon tax to be collected from sellers,calculate the dead weight loss associated with the tax,and explain why the dead weight loss occurs.
Correct Answer:
Verified
The deadweight loss equals .5 ∗ 2 ∗ 500 ...
View Answer
Unlock this answer now
Get Access to more Verified Answers free of charge
Related Questions

