Essay
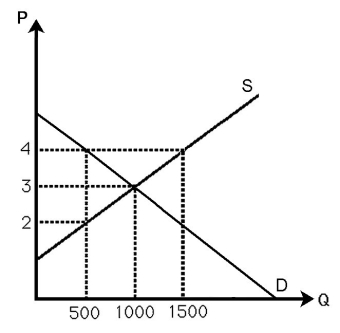
-The above figure shows the demand and supply curves in the market for milk.Currently the market is in equilibrium.If the government establishes a $2 per gallon price ceiling to ensure that children are nourished,estimate the change in p,Q,and social welfare.
Correct Answer:
Verified
At a price of $2,only 500 gall...
View Answer
Unlock this answer now
Get Access to more Verified Answers free of charge
Related Questions

