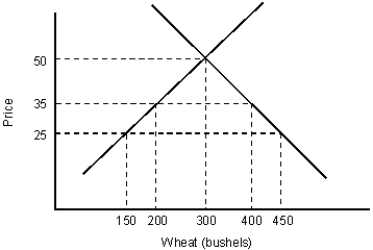
The figure given below depicts the negatively sloped demand and positively sloped supply curves of wheat in a country.Figure 21.2
-Which of the following tools of commercial policy acts as a quantitative restriction on imports?
A) Tariff
B) Subsidy
C) Health and Safety regulations
D) Quota
E) Government procurement
Correct Answer:
Verified
Q55: The figure below shows the demand (D)
Q56: The figure below shows the demand (D)
Q57: The figure below shows the demand (D)
Q58: The figure given below depicts the negatively
Q59: The figure given below depicts the negatively
Q61: The figure below shows the demand (D)
Q62: The figure below shows the demand (D)
Q63: The figure below shows the demand (D)
Q64: The figure below shows the demand (D)
Q65: The figure below shows the demand (D)
Unlock this Answer For Free Now!
View this answer and more for free by performing one of the following actions

Scan the QR code to install the App and get 2 free unlocks

Unlock quizzes for free by uploading documents