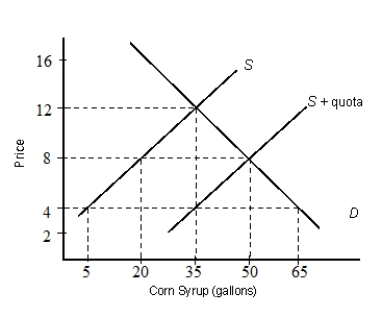
The figure below shows the demand (D) and supply (S) curves of corn syrups.Figure 21.3
-Suppose, in the United States, each farmer is given a federal agricultural subsidy worth $30,000. What will be the effect of such subsidy?
A) It discourages domestic agricultural production.
B) It allows U.S. farmers to sell their products for lower prices in foreign markets.
C) It gives foreign producers an unfair cost advantage.
D) It increases the amount of agricultural imports into the United States.
E) It reduces the prices of the primary products in the U.S. market.
Correct Answer:
Verified
Q60: The figure given below depicts the negatively
Q61: The figure below shows the demand (D)
Q62: The figure below shows the demand (D)
Q63: The figure below shows the demand (D)
Q64: The figure below shows the demand (D)
Q66: The figure below shows the demand (D)
Q67: The figure below shows the demand (D)
Q68: The figure below shows the demand (D)
Q69: The figure below shows the demand (D)
Q70: The figure below shows the demand (D)
Unlock this Answer For Free Now!
View this answer and more for free by performing one of the following actions

Scan the QR code to install the App and get 2 free unlocks

Unlock quizzes for free by uploading documents