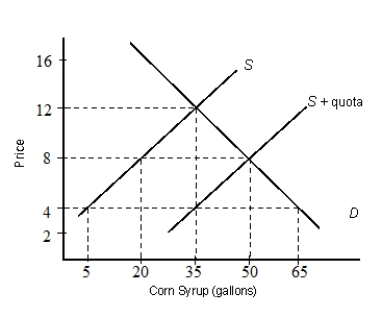
The figure below shows the demand (D) and supply (S) curves of corn syrups.Figure 21.3
-One of the negative impacts of export subsidy is that:
A) the price of the domestic good increases in the world market.
B) the domestic supply of the goods increases more than proportionately than increase in demand.
C) the domestic cost of production of the exportable increase.
D) it results in a general deflation and hence the domestic producers incur losses.
E) it is financed by the taxes paid by domestic consumers and hence it harms them.
Correct Answer:
Verified
Q61: The figure below shows the demand (D)
Q62: The figure below shows the demand (D)
Q63: The figure below shows the demand (D)
Q64: The figure below shows the demand (D)
Q65: The figure below shows the demand (D)
Q67: The figure below shows the demand (D)
Q68: The figure below shows the demand (D)
Q69: The figure below shows the demand (D)
Q70: The figure below shows the demand (D)
Q71: The figure below shows the demand (D)
Unlock this Answer For Free Now!
View this answer and more for free by performing one of the following actions

Scan the QR code to install the App and get 2 free unlocks

Unlock quizzes for free by uploading documents