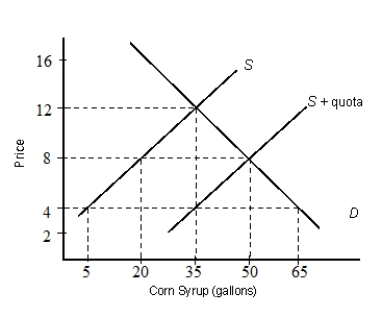
The figure below shows the demand (D) and supply (S) curves of corn syrups.Figure 21.3
-The trade-creation effect refers to:
A) the outcome of a preferential trade agreement that reduces economic efficiency by shifting production to a higher-cost producer.
B) the effect of an increase in the quantity of imports relative to the effect of a tariff applicable to all imports.
C) the outcome of a preferential trade agreement that allows a country to obtain goods at a lower cost than is available at home.
D) the effect of a diversion of production to a country that has comparative advantage due to a free trade agreement.
E) the effect of a decrease in the quantity of exports relative to the effect of a subsidy applicable to all exports.
Correct Answer:
Verified
Q63: The figure below shows the demand (D)
Q64: The figure below shows the demand (D)
Q65: The figure below shows the demand (D)
Q66: The figure below shows the demand (D)
Q67: The figure below shows the demand (D)
Q69: The figure below shows the demand (D)
Q70: The figure below shows the demand (D)
Q71: The figure below shows the demand (D)
Q72: The figure below shows the demand (D)
Q73: The figure below shows the demand (D)
Unlock this Answer For Free Now!
View this answer and more for free by performing one of the following actions

Scan the QR code to install the App and get 2 free unlocks

Unlock quizzes for free by uploading documents