The first panel in the following figure shows the domestic demand (D) and supply (S) curves of Columbian coffee and the second panel shows the import demand and export supply of Columbian coffee in the international market. Figure 20.1 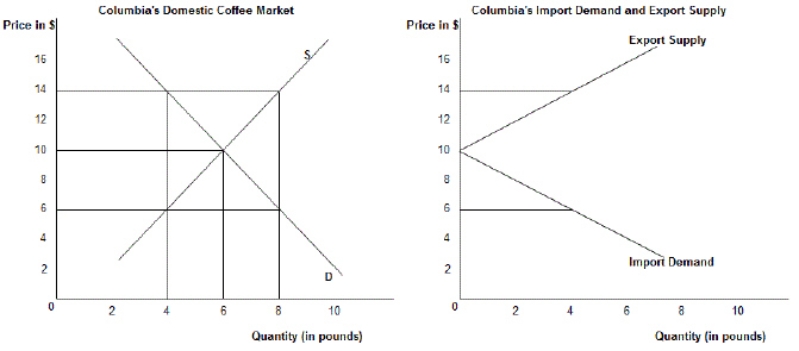
- Refer to Figure 20.1.The autarky equilibrium price of coffee in Columbia is:
A) $16.
B) $8.
C) $10.
D) $12.
E) $14.
Correct Answer:
Verified
Q44: Scenario 20.2
Suppose labor productivity differences are the
Q56: The first panel in the following figure
Q57: The first panel in the following figure
Q58: The following table shows that in one
Q59: Scenario 20.2 Suppose labor productivity differences are
Q61: The theory that explains the shift of
Q62: The figure given below shows the import
Q63: The fact that the United States exports
Q65: The figure given below shows the import
Q75: The table below shows the quantity demanded
Unlock this Answer For Free Now!
View this answer and more for free by performing one of the following actions

Scan the QR code to install the App and get 2 free unlocks

Unlock quizzes for free by uploading documents