The figure given below shows the import demand and export supply curves of corn of the U.S.and Mexico. Figure 20.2 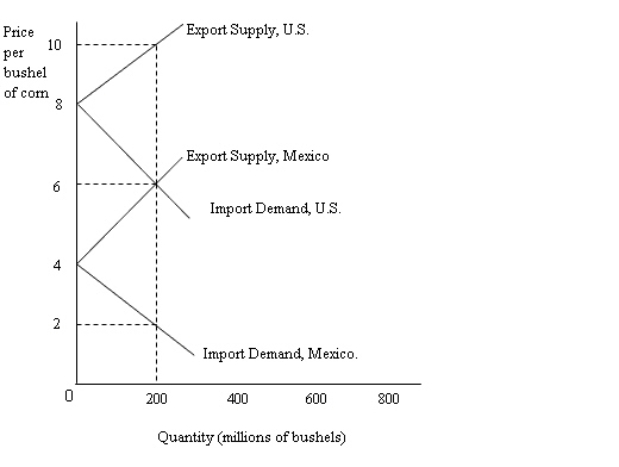
- According to Figure 20.2,the international equilibrium price of corn is:
A) $2.
B) $4.
C) $6.
D) $8.
E) $10.
Correct Answer:
Verified
Q60: The first panel in the following figure
Q61: The theory that explains the shift of
Q62: The figure given below shows the import
Q63: The fact that the United States exports
Q66: The product life cycle theory predicts that
Q67: The table below shows the quantity demanded
Q69: The product life cycle theory of comparative
Q70: The table below shows the quantity demanded
Q75: The table below shows the quantity demanded
Q80: The table below shows the quantity demanded
Unlock this Answer For Free Now!
View this answer and more for free by performing one of the following actions

Scan the QR code to install the App and get 2 free unlocks

Unlock quizzes for free by uploading documents