The figure below shows two Lorenz curves,Y and Z. Figure 19.1 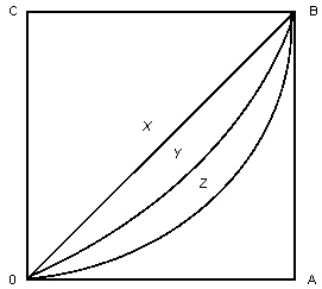
-According to Figure 19.1,which of the following is true?
A) Line OXB is the line of perfect income inequality.
B) Curve OYB represents a less equal distribution of income than curve OZB.
C) Line AB represents a society in which wealth is shared equally among individuals.
D) Line OXB is the line of perfect income equality.
E) Line AB represents a society in which 50 percent of the population receives all the income.
Correct Answer:
Verified
Q22: The figure given below shows the Lorenz
Q23: The figure given below shows the Lorenz
Q23: The figure given below shows the Lorenz
Q26: Which of the following refers to per
Q27: According to the Bureau of Labor Statistics,the
Q30: The figure given below shows the Lorenz
Q31: The figure given below shows the Lorenz
Q32: The figure given below shows the Lorenz
Q35: The figure given below shows the Lorenz
Q36: The figure given below shows the Lorenz
Unlock this Answer For Free Now!
View this answer and more for free by performing one of the following actions

Scan the QR code to install the App and get 2 free unlocks

Unlock quizzes for free by uploading documents