The figure given below shows the Lorenz curves of two countries (Country A and Country B) . Figure 19.2
Total income (cumulative percentage) 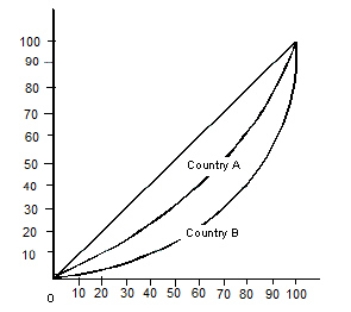 Total population (cumuative percentage)
-In Figure 19.2,the poorest 60 percent of the population in Country B receive:
A) 30 percent of the national income.
B) 40 percent of the national income.
C) 60 percent of the national income.
D) 20 percent of the national income.
E) 10 percent of the national income.
Correct Answer:
Verified
Q3: The figure given below represents an imperfectly
Q18: The figure given below represents an imperfectly
Q20: If the Gini co-efficient for any economy
Q26: Which of the following refers to per
Q27: According to the Bureau of Labor Statistics,the
Q28: The figure below shows two Lorenz curves,Y
Q30: The figure given below shows the Lorenz
Q31: The figure given below shows the Lorenz
Q35: The figure given below shows the Lorenz
Q42: The figure given below shows the Lorenz
Unlock this Answer For Free Now!
View this answer and more for free by performing one of the following actions

Scan the QR code to install the App and get 2 free unlocks

Unlock quizzes for free by uploading documents