The figure given below represents demand for and supply of hospital beds in Anytown,U.S.A.,as shown by curves D and S1 in the following figure.If the hospital receives permission to expand,its new supply curve will be S2.Price level P1 is the fixed prospective payment reimbursement rate paid by Medicare to the hospital,regardless of actual cost. Figure 18.3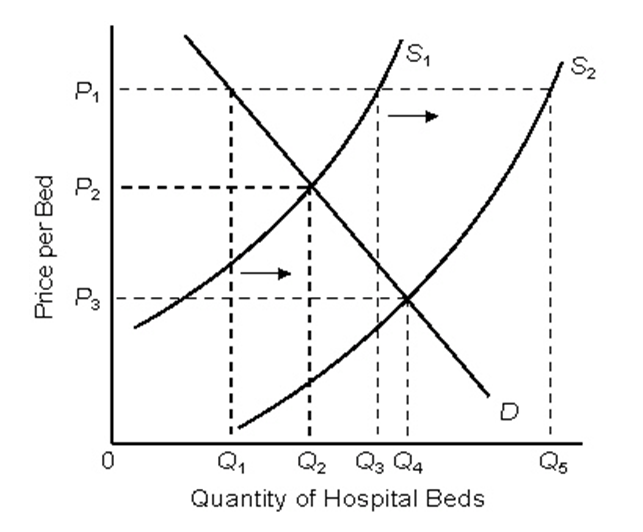
-Based on the information given in Figure 18.3,in order to increase its occupancy rate prior to the expansion,this hospital should:
A) discourage comparison-shopping by prospective patients.
B) give financial incentives to doctors without privileges to admit patients.
C) increase the number of beds.
D) eliminate its advertising budget.
E) lower its price for certain cost-effective medical procedures.
Correct Answer:
Verified
Q52: The following figure shows the demand (D)
Q53: Which of the following reasons justifies the
Q54: Which of the following is true of
Q55: Empirical evidences suggest that the expenditure on
Q56: The figure given below represents demand for
Q58: The figure below shows the demand (AD)
Q59: The figure below shows the demand (AD)
Q60: Why does the demand curve for human
Q61: If the ratio of those working to
Q62: Why didn't the supply of medical care
Unlock this Answer For Free Now!
View this answer and more for free by performing one of the following actions

Scan the QR code to install the App and get 2 free unlocks

Unlock quizzes for free by uploading documents