The figure given below shows the demand curves (D1 and D2) and supply curves (S1 and S2) of labor in the labor market. Figure: 15.2 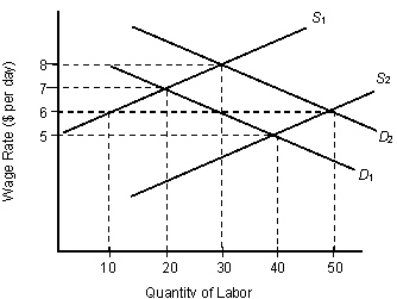
- Refer to Figure 15.2.At the initial equilibrium (when demand is D1 and supply is S1) ,the wage rate and labor employment are:
A) $7 and 20 laborers.
B) $8 and 30 laborers.
C) $6 and 50 laborers.
D) $5 and 20 laborers.
E) $5 and 10 laborers.
Correct Answer:
Verified
Q3: The figures given below show the demand
Q4: Which of the following is not a
Q5: Which of the following is a reason
Q6: The figure given below shows the demand
Q7: Which of the following statements contradicts the
Q9: The labor demand curve is based on
Q10: The figure below shows the supply curve
Q11: It is said that a wage increase
Q12: Why does the labor market have more
Q13: The figures given below show the demand
Unlock this Answer For Free Now!
View this answer and more for free by performing one of the following actions

Scan the QR code to install the App and get 2 free unlocks

Unlock quizzes for free by uploading documents