The figures given below show the demand (D) and supply (S) curves of labor in two different markets. Figure 15.3 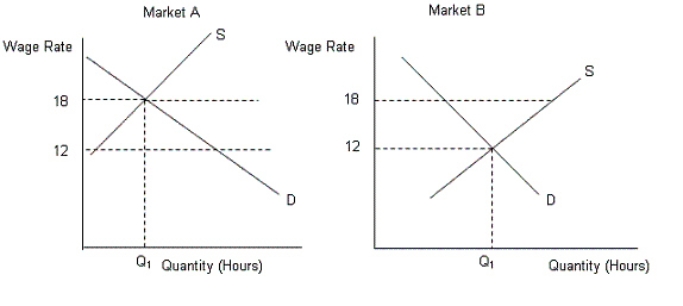
- Refer to Figure 15.3.If the wage rates in market A and market B were set at $20,then:
A) both the markets would be in equilibrium.
B) there would be a shortage of workers in market A and a surplus of workers in market B.
C) there would be a shortage of workers in market B and a surplus of workers in market A.
D) there would be a surplus of workers in both markets.
E) there would be a shortage of workers in both markets.
Correct Answer:
Verified
Q1: Scenario 14.1
A worker in Firm A earns
Q4: Which of the following is not a
Q5: The figure below shows the supply curve
Q5: Which of the following is a reason
Q6: The figure given below shows the demand
Q7: Which of the following statements contradicts the
Q8: The figure given below shows the demand
Q9: The labor demand curve is based on
Q10: The figure below shows the supply curve
Q11: It is said that a wage increase
Unlock this Answer For Free Now!
View this answer and more for free by performing one of the following actions

Scan the QR code to install the App and get 2 free unlocks

Unlock quizzes for free by uploading documents