The following figures show the demand and supply of labor in two different types of labor market. Figure 15.5 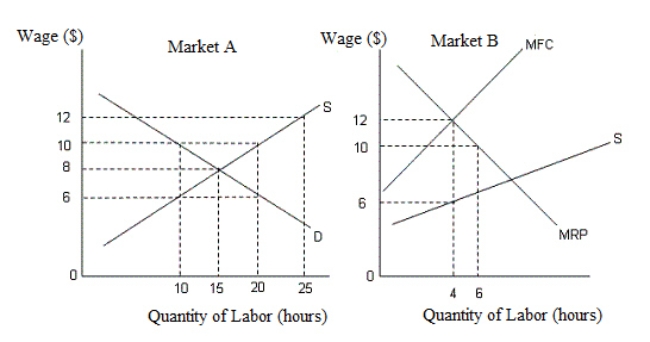 In the figures,
D: Demand curve for labor
S: Supply curve of labor
MRP: Marginal revenue product
MFC: Marginal factor cost
-The Market A described in Figure 15.5 is a(n) :
A) monopsonist market.
B) monopolistic market.
C) perfectly competitive labor market.
D) monopolistically competitive market.
E) oligopolistic market.
Correct Answer:
Verified
Q41: The figure given below shows the income-leisure
Q43: The figure given below shows the income-leisure
Q46: The figure given below shows the income-leisure
Q55: Which of the following is true of
Q58: If the tax rate increases with increase
Q60: The figure given below shows the demand
Q61: The figure given below shows the income-leisure
Q62: Which of the following reasons will most
Q66: The figure given below shows the income-leisure
Q76: The figure given below shows the income-leisure
Unlock this Answer For Free Now!
View this answer and more for free by performing one of the following actions

Scan the QR code to install the App and get 2 free unlocks

Unlock quizzes for free by uploading documents