The figure given below shows the demand curve in the U.S. and the cost curves in U.S. and India.Figure: 16.4
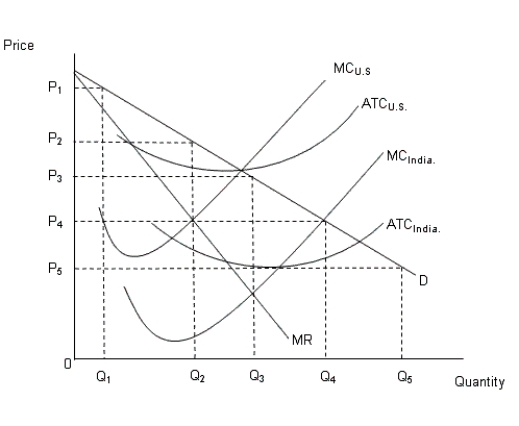 In the figure:
MC: Marginal cost curve
ATC: Average total cost curve
D: Demand curve in the U.S.MR: Marginal revenue curve in the U.S.
-Suppose a tax rate of 10 percent applies to all income up to $20,000 a year, income above $20,000 up to $50,000 a year is taxed at a rate of 15%, and income above $50,000 a year is taxed at 20%. Calculate the absolute amount of tax paid by a person whose annual income is $30,000.
A) $2,000
B) $2,500
C) $4,500
D) $4,000
E) $3,500
Correct Answer:
Verified
Q55: The figure given below shows the income-leisure
Q56: The figure given below shows the demand
Q57: The figure given below shows the demand
Q58: The figure given below shows the income-leisure
Q59: The figure given below shows the income-leisure
Q61: The figure given below shows the income-leisure
Q62: The figure given below shows the income-leisure
Q63: The figure given below shows the income-leisure
Q64: The figure given below shows the income-leisure
Q65: The following figures show the demand (D)
Unlock this Answer For Free Now!
View this answer and more for free by performing one of the following actions

Scan the QR code to install the App and get 2 free unlocks

Unlock quizzes for free by uploading documents