The figure given below shows the demand curve in the U.S. and the cost curves in U.S. and India.Figure: 16.4
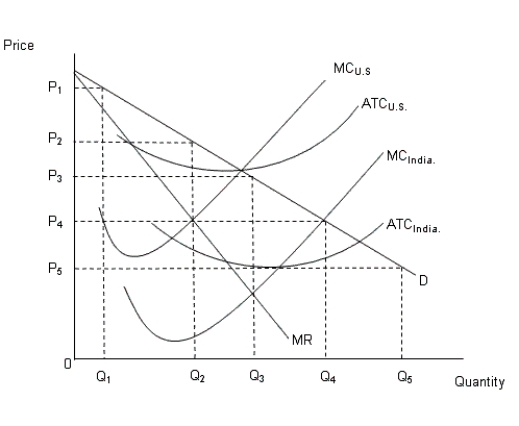 In the figure:
MC: Marginal cost curve
ATC: Average total cost curve
D: Demand curve in the U.S.MR: Marginal revenue curve in the U.S.
-Why has there been an increase in the inequality of income?
A) The demand for skilled workers has declined.
B) The demand for skilled workers has remained constant and the demand for unskilled workers has declined.
C) The government policies went against the unskilled workers.
D) The demand for skilled workers has increased and the demand for unskilled workers has not kept pace.
E) The demand for unskilled workers has increased as they could be hired for lower wages.
Correct Answer:
Verified
Q52: The figure given below shows the income-leisure
Q53: The figure given below shows the income-leisure
Q54: The figure given below shows the income-leisure
Q55: The figure given below shows the income-leisure
Q56: The figure given below shows the demand
Q58: The figure given below shows the income-leisure
Q59: The figure given below shows the income-leisure
Q60: The figure given below shows the demand
Q61: The figure given below shows the income-leisure
Q62: The figure given below shows the income-leisure
Unlock this Answer For Free Now!
View this answer and more for free by performing one of the following actions

Scan the QR code to install the App and get 2 free unlocks

Unlock quizzes for free by uploading documents