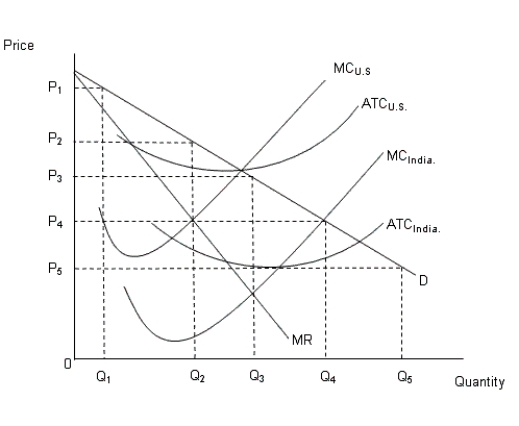
The figure given below shows the demand curve in the U.S. and the cost curves in U.S. and India.Figure: 16.4
 In the figure:
MC: Marginal cost curve
ATC: Average total cost curve
D: Demand curve in the U.S.MR: Marginal revenue curve in the U.S.
-An increase in the income tax rates:
A) makes the labor supply curve more inelastic.
B) increases the opportunity cost of leisure.
C) lowers the opportunity cost of leisure.
D) shifts the labor supply curve to the right.
E) shifts the labor demand curve to the right.
Correct Answer:
Verified
Q51: The figure given below shows the income-leisure
Q52: The figure given below shows the income-leisure
Q53: The figure given below shows the income-leisure
Q54: The figure given below shows the income-leisure
Q55: The figure given below shows the income-leisure
Q57: The figure given below shows the demand
Q58: The figure given below shows the income-leisure
Q59: The figure given below shows the income-leisure
Q60: The figure given below shows the demand
Q61: The figure given below shows the income-leisure
Unlock this Answer For Free Now!
View this answer and more for free by performing one of the following actions

Scan the QR code to install the App and get 2 free unlocks

Unlock quizzes for free by uploading documents