The following figures show the demand and supply of labor in two different types of labor market. Figure 15.5 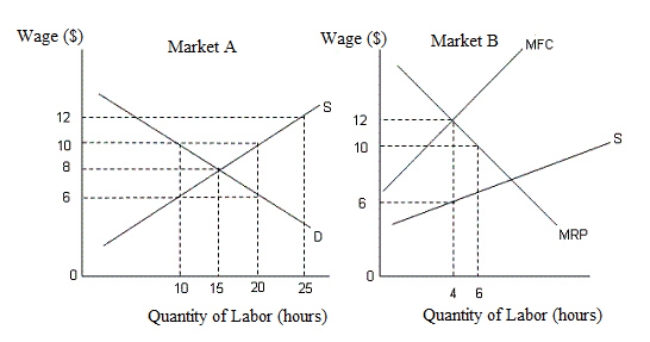 In the figures,
D: Demand curve for labor
S: Supply curve of labor
MRP: Marginal revenue product
MFC: Marginal factor cost
-In Figure 15.5,if a minimum wage of $10 is set by the government,then in market B:
A) wage increases but labor employment decreases.
B) wage increases but labor employment remains constant.
C) wage decreases from $12 to $10.
D) both wage and employment increase.
E) both wage and employment decrease.
Correct Answer:
Verified
Q36: The figures given below show the demand
Q37: Which of the following statements is true?
A)Income
Q38: Why do skilled workers earn relatively higher
Q39: The figure given below shows the demand
Q40: Which of the following refers to human
Q45: The figure given below shows the income-leisure
Q45: The figure given below shows the income-leisure
Q46: The figure given below shows the income-leisure
Q48: The figure given below shows the income-leisure
Q59: The figure given below shows the income-leisure
Unlock this Answer For Free Now!
View this answer and more for free by performing one of the following actions

Scan the QR code to install the App and get 2 free unlocks

Unlock quizzes for free by uploading documents