The figures given below show the demand (D) and supply (S) curves of labor in two different markets. Figure 15.3 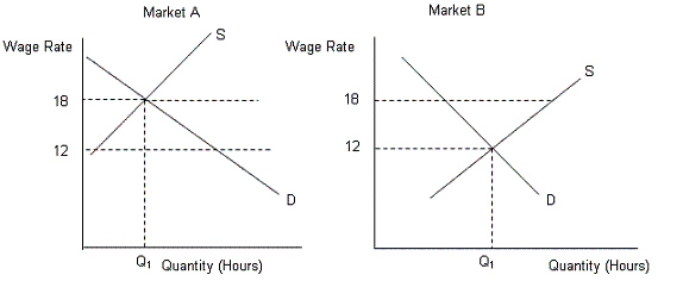
-Which of the following is a reason for the wage differential shown in Figure 15.3?
A) The workers in Market B are more productive than the workers in Market A.
B) The workers in Market B are unionized whereas the workers in Market A are not.
C) Market B hires a larger number of skilled workers than Market A.
D) Market A represents the market for a risky occupation.
E) Working conditions offered by the firms in Market B are uncongenial.
Correct Answer:
Verified
Q30: The figures given below show the demand
Q31: The figure given below shows the demand
Q32: Investment in human capital implies:
A)investment on machines,technological
Q33: Why are a large number of IT
Q37: Which of the following statements is true?
A)Income
Q38: Why do skilled workers earn relatively higher
Q39: The figures given below show the demand
Q39: The figure given below shows the demand
Q40: Which of the following refers to human
Q41: The following figures show the demand and
Unlock this Answer For Free Now!
View this answer and more for free by performing one of the following actions

Scan the QR code to install the App and get 2 free unlocks

Unlock quizzes for free by uploading documents