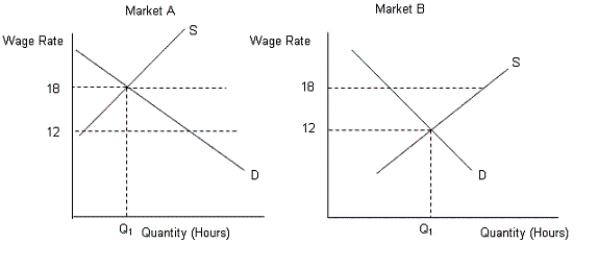
The figures given below show the demand (D) and supply (S) curves of labor in two different markets.Figure 16.3
-The ratio of the median income of college-to high school-educated workers is called the _____.
A) college income premium
B) college income differential
C) college income benefit
D) college income compensation
E) education income gap
Correct Answer:
Verified
Q25: The figures given below show the demand
Q26: The figures given below show the demand
Q27: The figure given below shows the demand
Q28: The figures given below show the demand
Q29: The figures given below show the demand
Q31: The figures given below show the demand
Q32: The figures given below show the demand
Q33: The figures given below show the demand
Q34: The figures given below show the demand
Q35: The figure given below shows the demand
Unlock this Answer For Free Now!
View this answer and more for free by performing one of the following actions

Scan the QR code to install the App and get 2 free unlocks

Unlock quizzes for free by uploading documents