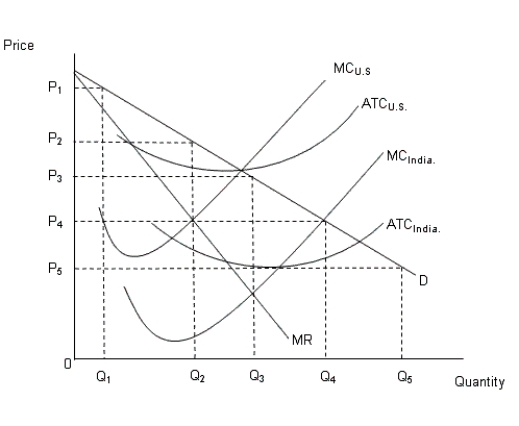
The figure given below shows the demand curve in the U.S. and the cost curves in U.S. and India.Figure: 16.4
 In the figure:
MC: Marginal cost curve
ATC: Average total cost curve
D: Demand curve in the U.S.MR: Marginal revenue curve in the U.S.
-According to Figure 16.4, one of the possible outcomes of such offshoring is that:
A) the price of the good in question rises in the U.S. market.
B) the demand for Indian worker declines.
C) the demand for U.S. workers increase.
D) the price of the good in question rises in the Indian market.
E) the Indian workers replace the U.S. workers.
Correct Answer:
Verified
Q22: The figures given below show the demand
Q23: The figures given below show the demand
Q24: The figure given below shows the demand
Q25: The figures given below show the demand
Q26: The figures given below show the demand
Q28: The figures given below show the demand
Q29: The figures given below show the demand
Q30: The figures given below show the demand
Q31: The figures given below show the demand
Q32: The figures given below show the demand
Unlock this Answer For Free Now!
View this answer and more for free by performing one of the following actions

Scan the QR code to install the App and get 2 free unlocks

Unlock quizzes for free by uploading documents