The figures given below show the demand (D) and supply (S) curves of labor in two different markets.Figure 16.3
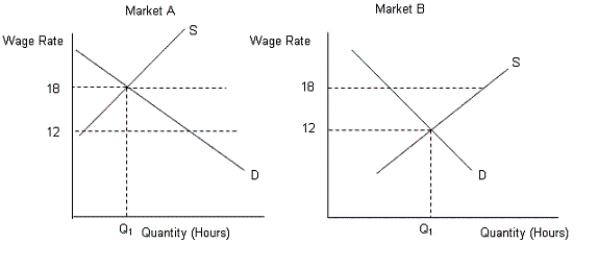
-Refer to Figure 16.3. If the wage rates in market A and market B were set at $15, then:
A) there would be a shortage of workers in both markets.
B) there would be a surplus of workers in both markets.
C) there would be a shortage of workers in market A and a surplus of workers in market B.
D) there would be a shortage of workers in market B and a surplus of workers in market A.
E) both the markets will be in equilibrium.
Correct Answer:
Verified
Q17: The figure below shows the supply curve
Q18: The figure given below shows the demand
Q19: The figure given below shows the demand
Q20: The figure below shows the supply curve
Q21: The figures given below show the demand
Q23: The figures given below show the demand
Q24: The figure given below shows the demand
Q25: The figures given below show the demand
Q26: The figures given below show the demand
Q27: The figure given below shows the demand
Unlock this Answer For Free Now!
View this answer and more for free by performing one of the following actions

Scan the QR code to install the App and get 2 free unlocks

Unlock quizzes for free by uploading documents