The figure given below shows the demand curves (D1 and D2) and supply curves (S1 and S2) of labor in the labor market.Figure: 16.2
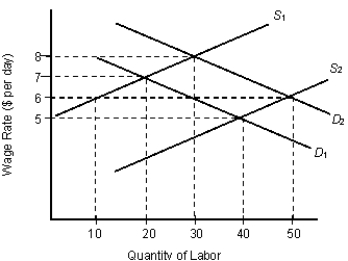
-Refer to Figure 16.2. At the initial equilibrium (when demand is D1 and supply is S1) , the firm employs _____ laborers at a wage of _____.
A) 20; $7
B) 30; $8
C) 50; $6
D) 20; $5
E) 10; $5
Correct Answer:
Verified
Q13: The figure below shows the supply curve
Q14: The figure given below shows the demand
Q15: Scenario 14.1
A worker in Firm A earns
Q16: The figure below shows the supply curve
Q17: The figure below shows the supply curve
Q19: The figure given below shows the demand
Q20: The figure below shows the supply curve
Q21: The figures given below show the demand
Q22: The figures given below show the demand
Q23: The figures given below show the demand
Unlock this Answer For Free Now!
View this answer and more for free by performing one of the following actions

Scan the QR code to install the App and get 2 free unlocks

Unlock quizzes for free by uploading documents