The figure given below represents equilibrium in the labor market. Figure 14.5 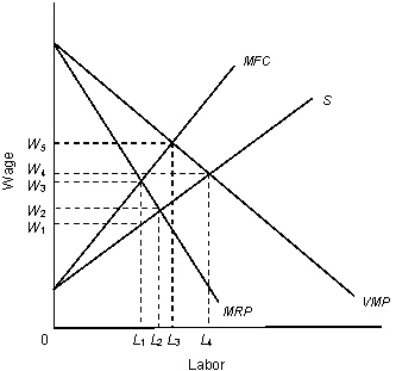 In the figure,
VMP: Value of marginal product curve
MRP: Marginal revenue product curve
MFC: Marginal factor cost
S: Supply curve of labor
According to Figure 14.5,what is the equilibrium level of employment?
A) 0 units
B) L1 units.
C) L2 units.
D) L3 units.
E) L4 units.
Correct Answer:
Verified
Q36: The figure given below shows the marginal
Q38: The table below shows the total output
Q41: The following table shows the marginal revenue
Q42: The following table shows the marginal productivity
Q44: The following table shows total output produced
Q46: The following figure represents the equilibrium in
Q47: The following table shows total output produced
Q49: The following figure represents the equilibrium in
Q50: The following figure represents the equilibrium in
Q50: A monopolist hiring labor in a perfectly
Unlock this Answer For Free Now!
View this answer and more for free by performing one of the following actions

Scan the QR code to install the App and get 2 free unlocks

Unlock quizzes for free by uploading documents