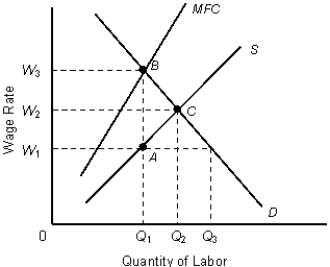
The following figure represents the equilibrium in the labor market.Figure 14.4
 In the figure,
MFC: Marginal Factor Cost curve
D: Demand or the Marginal Revenue Product curve
S: Supply curve
-A monopsonist firm pays a price to a factor that is:
A) equal to the marginal revenue product of the factor.
B) greater than the marginal revenue product of the factor.
C) equal to the marginal factor cost.
D) greater than the marginal factor cost.
E) less than the marginal revenue product of the factor.
Correct Answer:
Verified
Q45: The following table shows total output produced
Q46: The figure given below represents equilibrium in
Q47: The following table shows total output produced
Q48: The following table shows total output produced
Q49: The following figure represents the equilibrium in
Q51: The following figure represents the equilibrium in
Q52: The following figure represents the equilibrium in
Q53: The following table shows total output produced
Q54: The following figure represents the equilibrium in
Q55: The following figure represents the equilibrium in
Unlock this Answer For Free Now!
View this answer and more for free by performing one of the following actions

Scan the QR code to install the App and get 2 free unlocks

Unlock quizzes for free by uploading documents