The figure given below represents equilibrium in the labor market.Figure 14.5
In the figure,
VMP: Value of marginal product curve
MRP: Marginal revenue product curve
MFC: Marginal factor cost
S: Supply curve of labor
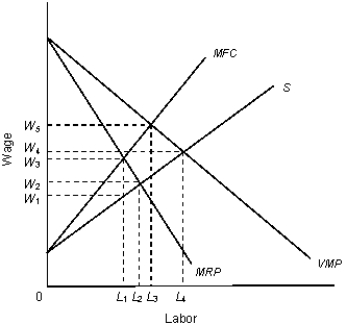
-In Figure 14.5, the firm is:
A) a monopsonist in the labor market and a perfect competitor in the output market.
B) a monopsonist in the labor market and a monopolist in the output market.
C) a perfect competitor in all markets.
D) a perfect competitor in the labor market and a monopolist in the output market.
E) either a monopolist or a monopsonist, but not both.
Correct Answer:
Verified
Q41: The following table shows total output produced
Q42: The figure given below represents equilibrium in
Q43: The following table shows the marginal productivity
Q44: The figure given below represents equilibrium in
Q45: The following table shows total output produced
Q47: The following table shows total output produced
Q48: The following table shows total output produced
Q49: The following figure represents the equilibrium in
Q50: The following figure represents the equilibrium in
Q51: The following figure represents the equilibrium in
Unlock this Answer For Free Now!
View this answer and more for free by performing one of the following actions

Scan the QR code to install the App and get 2 free unlocks

Unlock quizzes for free by uploading documents