The figure below shows the demand and supply curves in the market for elementary education. Figure 13.1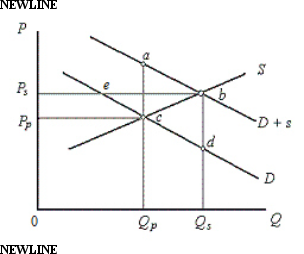 In the figure,
D: Private demand curve for elementary education
D + s: Demand curve which includes public benefits
S: Supply curve of education
Price and Quantity have been taken on vertical and horizontal axes respectively.
-According to Figure 13.1,the outcome of an unregulated,unsubsidized market would be:
A) point a.
B) point b.
C) point c.
D) point d.
E) point e.
Correct Answer:
Verified
Q52: The figure given below shows the demand
Q53: If education has positive externalities:
A)the private market
Q54: The European Union Emission Trading Scheme is
Q55: Which of the following is a measure
Q56: Which of the following is an example
Q58: The figure below shows the demand and
Q59: The figure given below shows the demand
Q60: When the government imposes a tax on
Q61: When a firm increases its short-run supplies
Q62: A market in which adverse selection may
Unlock this Answer For Free Now!
View this answer and more for free by performing one of the following actions

Scan the QR code to install the App and get 2 free unlocks

Unlock quizzes for free by uploading documents