The figure given below shows the demand and supply curves of automobiles. Figure 13.3 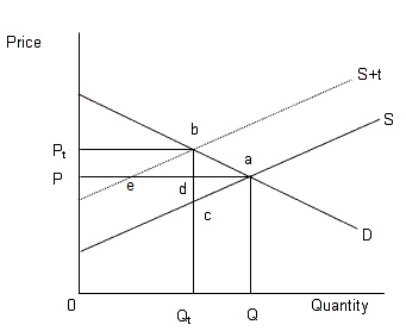 In the figure,
D: Demand curve of automobiles
S: Supply of automobiles prior to the tax
S+t: Supply of automobiles after the tax
-According to Figure 13.3,the market attains equilibrium before the tax at:
A) point d.
B) point a.
C) point b.
D) point c.
E) point e.
Correct Answer:
Verified
Q54: The European Union Emission Trading Scheme is
Q55: Which of the following is a measure
Q56: Which of the following is an example
Q57: The figure below shows the demand and
Q58: The figure below shows the demand and
Q60: When the government imposes a tax on
Q61: When a firm increases its short-run supplies
Q62: A market in which adverse selection may
Q63: Which of the following wouldhelp to minimize
Q64: Which of following would help minimize moral
Unlock this Answer For Free Now!
View this answer and more for free by performing one of the following actions

Scan the QR code to install the App and get 2 free unlocks

Unlock quizzes for free by uploading documents