The figure given below shows the demand and supply curves of automobiles. Figure 13.3 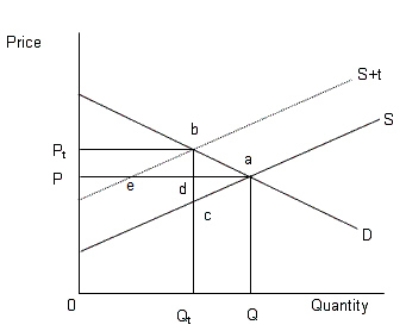 In the figure,
D: Demand curve of automobiles
S: Supply of automobiles prior to the tax
S+t: Supply of automobiles after the tax
-Figure 13.3 represents a situation of:
A) positive externality.
B) Pareto efficiency.
C) negative externality.
D) tragedy of commons.
E) free rider problem.
Correct Answer:
Verified
Q45: When the government tries to control pollution
Q46: The Clean Air Act of 1972 required
Q47: The figure given below shows the demand
Q48: The figure given below shows the demand
Q51: The figure given below shows the demand
Q52: The figure given below shows the demand
Q53: If education has positive externalities:
A)the private market
Q54: The European Union Emission Trading Scheme is
Q55: Which of the following is a measure
Q58: The figure given below shows the demand
Unlock this Answer For Free Now!
View this answer and more for free by performing one of the following actions

Scan the QR code to install the App and get 2 free unlocks

Unlock quizzes for free by uploading documents