The figure given below shows the demand for permits and the maximum permissible level of pollution. Figure 13.4 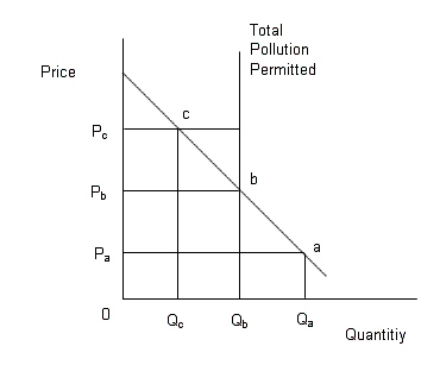 In the figure,
The downward sloping line is the demand curve of permits;
The vertical line denotes the maximum permissible limit of pollution.
-Refer to Figure 13.4.Suppose the government wishes to reduce pollution to a quantity of Qb.If it sells marketable pollution permits at a quantity of Qb then:
A) firms will bid the price of the permits up to a price of Pa,and Qa pollution will result.
B) firms will bid the price of the permits up to a price of Pb,and Qb pollution will result.
C) firms will bid the price of the permits up to a price of Pc,and Qc pollution will result.
D) firms will bid the price of the permits up to a price of Pc,and Qb pollution will result.
E) firms will not be willing to pay a price for the permits,so no pollution will be reduced.
Correct Answer:
Verified
Q46: The Clean Air Act of 1972 required
Q47: The figure given below shows the demand
Q48: The figure given below shows the demand
Q50: The figure given below shows the demand
Q52: The figure given below shows the demand
Q53: If education has positive externalities:
A)the private market
Q54: The European Union Emission Trading Scheme is
Q55: Which of the following is a measure
Q56: Which of the following is an example
Q58: The figure given below shows the demand
Unlock this Answer For Free Now!
View this answer and more for free by performing one of the following actions

Scan the QR code to install the App and get 2 free unlocks

Unlock quizzes for free by uploading documents