In the following figure,the first panel shows a market situation prior to regulation and the second panel shows the effects of regulation. Figure 12.2 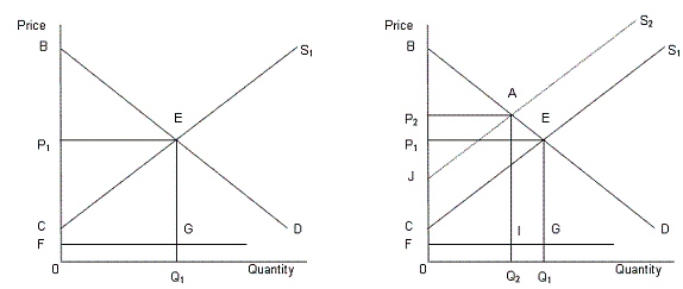 In the figure,
D: Demand curve for automobiles
S1: Supply curve of automobiles prior to regulation
S2: Supply curve of automobiles after regulation
FG: Clean up cost per unit
-What is the total societal surplus prior to regulation described in Figure 12.2?
A) Area 0FGQ1.
B) Area BEP1.
C) Area CEP1.
D) Area FGEP1.
E) Area BEC.
Correct Answer:
Verified
Q53: In the following figure,the first panel shows
Q53: In the following figure, the first panel
Q54: Why do the regulated companies oppose deregulation?
A)They
Q55: If a market becomes deregulated and is
Q56: An example of the opportunity costs involved
Q57: Cities and local governments in the United
Q57: The figure below shows revenue and cost
Q60: In the following figure,the first panel shows
Q76: In the following figure, the first panel
Q77: In the following figure, the first panel
Unlock this Answer For Free Now!
View this answer and more for free by performing one of the following actions

Scan the QR code to install the App and get 2 free unlocks

Unlock quizzes for free by uploading documents