In the following figure,the first panel shows a market situation prior to regulation and the second panel shows the effects of regulation. Figure 12.2 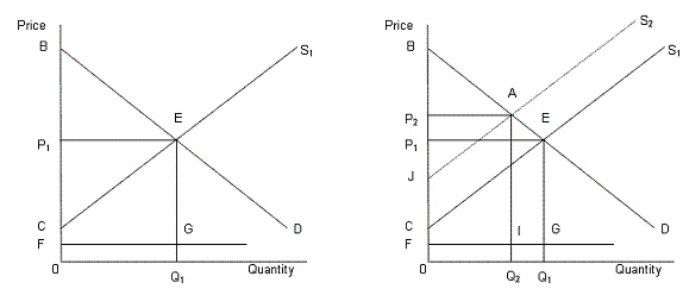 In the figure,
D: Demand curve for automobiles
S1: Supply curve of automobiles prior to regulation
S2: Supply curve of automobiles after regulation
FG: Clean up cost per unit
-Refer to Figure 12.2.The regulation will benefit the society if:
A) area BAJ > area 0FIQ2.
B) area AECJ > area IGQ1Q2.
C) area IGQ1Q2 > area AECJ.
D) area BAJ > BAC.
E) area 0FIQ2 > area BAJ.
Correct Answer:
Verified
Q45: The figure below shows revenue and cost
Q48: Why was trucking deregulated in the U.S.in
Q51: In the following figure,the first panel shows
Q52: When regulating a natural monopoly,government officials face
Q54: Why do the regulated companies oppose deregulation?
A)They
Q55: If a market becomes deregulated and is
Q56: In the following figure, the first panel
Q56: An example of the opportunity costs involved
Q57: Cities and local governments in the United
Q58: In the following figure,the first panel shows
Unlock this Answer For Free Now!
View this answer and more for free by performing one of the following actions

Scan the QR code to install the App and get 2 free unlocks

Unlock quizzes for free by uploading documents