The figure given below shows revenue and cost curves of a monopolistically competitive firm. Figure: 11.1 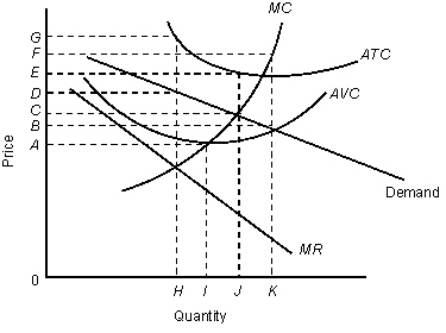 In the figure,
MR: Marginal revenue curve
ATC: Average total cost curve
AVC: Average variable cost curve
MC: Marginal cost curve
-Consider the monopolistically competitive firm described in the Figure 11.1.The profit-maximizing output level and price are,respectively:
A) 0 and 0.
B) H and D.
C) I and A.
D) J and C.
E) J and E.
Correct Answer:
Verified
Q3: The figure given below shows the cost
Q6: The figure given below shows the cost
Q11: The figure given below shows the cost
Q14: Monopolistic competition is similar to perfect competition
Q16: The market structure called monopolistic competition is
Q18: The figure given below shows the cost
Q21: The figure given below shows the revenue
Q22: Advertising,brand names,packaging,and celebrity endorsements all occur in
Q24: The figure given below shows the revenue
Q26: The figure below shows the revenue and
Unlock this Answer For Free Now!
View this answer and more for free by performing one of the following actions

Scan the QR code to install the App and get 2 free unlocks

Unlock quizzes for free by uploading documents