The figure given below shows the revenue and cost curves of a monopolistically competitive firm. Figure 11.4 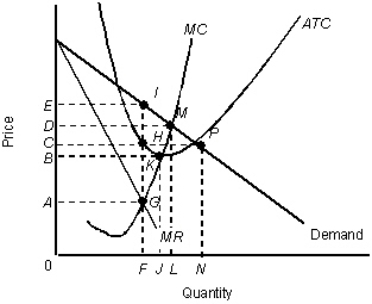
MR: Marginal revenue curve
ATC: Average total cost curve
MC: Marginal cost curve
-Assume that the firm in Figure 11.4 is monopolistically competitive.In the long run,we would expect:
A) the price of the firm's output to increase.
B) entry of new firms because economic profits are positive.
C) exit of few existing firms because economic profits are negative.
D) the firm's demand curve to shift outward.
E) the firm's demand curve to becomes less elastic.
Correct Answer:
Verified
Q3: The figure given below shows the cost
Q19: The figure given below shows revenue and
Q21: The figure given below shows the revenue
Q22: Advertising,brand names,packaging,and celebrity endorsements all occur in
Q23: The figure given below shows the revenue
Q26: The figure below shows the revenue and
Q26: The figure given below shows the revenue
Q27: The figure given below shows the revenue
Q28: If all the firms in a monopolistically
Q29: The figure given below shows the revenue
Unlock this Answer For Free Now!
View this answer and more for free by performing one of the following actions

Scan the QR code to install the App and get 2 free unlocks

Unlock quizzes for free by uploading documents