The figure given below shows the revenue and cost curves of a monopolistically competitive firm. Figure: 11.3 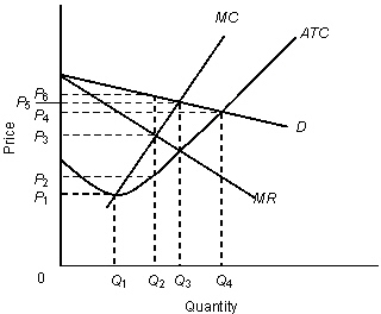 In the figure,
D: Demand curve
MR: Marginal revenue curve
MC: Marginal cost curve
ATC: Average total cost curve
-The monopolistically competitive firm in Figure 11.3 will maximize profits (or minimize losses) by producing _____ and charging _____.
A) Q2; P6
B) Q1; P1
C) Q2; P2
D) Q3; P3
E) Q4; P5
Correct Answer:
Verified
Q22: The figure given below shows the revenue
Q27: The figure given below shows the revenue
Q27: The figure given below shows the revenue
Q28: If all the firms in a monopolistically
Q28: The figure given below shows the revenue
Q29: The figure given below shows the revenue
Q34: The figure given below shows the revenue
Q36: The figure given below shows the revenue
Q37: If economic losses exist in a monopolistically
Q38: The figure below shows the revenue and
Unlock this Answer For Free Now!
View this answer and more for free by performing one of the following actions

Scan the QR code to install the App and get 2 free unlocks

Unlock quizzes for free by uploading documents