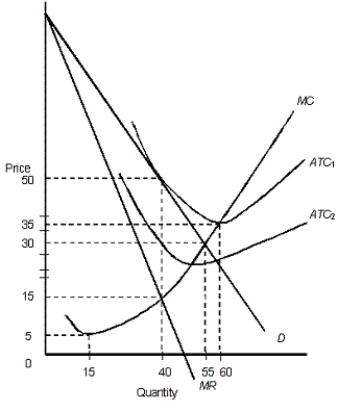
The figure below shows the revenue and cost curves of a monopolistically competitive firm.Figure: 12.2
 In the figure,
D: Demand curve
MR: Marginal revenue curve
ATC1 and ATC2: Average total cost curves
MC: Marginal cost curve
-In contrast to perfect competition, in a monopolistically competitive industry:
A) new firms entering the market produce a good that is identical to the existing ones.
B) new firms entering the market produce a completely different product.
C) there are legal restrictions on the entry of new firms.
D) new firms entering the market produce a close substitute, not an identical or standardized product.
E) new firms are allowed to enter the industry but there are legal restrictions on their exit.
Correct Answer:
Verified
Q33: The figure given below shows the revenue
Q34: The figure given below shows the revenue
Q35: The figure given below shows the revenue
Q36: The figure given below shows the revenue
Q37: The figure given below shows the revenue
Q39: The figure given below shows the revenue
Q40: The figure below shows the revenue and
Q41: The following table shows the payoff matrix
Q42: The figure given below shows the revenue
Q43: The following table shows the payoff matrix
Unlock this Answer For Free Now!
View this answer and more for free by performing one of the following actions

Scan the QR code to install the App and get 2 free unlocks

Unlock quizzes for free by uploading documents