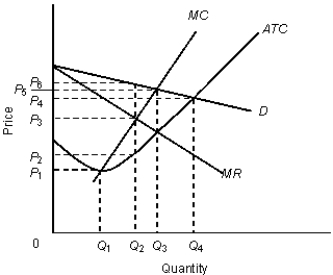
The figure given below shows the revenue and cost curves of a monopolistically competitive firm.Figure: 12.3
 In the figure,
D: Demand curve
MR: Marginal revenue curve
MC: Marginal cost curve
ATC: Average total cost curve
-The profit per unit of output for the firm in the Figure 12.3 is:
A) P5 - P3.
B) P6 - P3.
C) P3 - P2.
D) P6 - P2.
E) P4 - P2.
Correct Answer:
Verified
Q34: The figure given below shows the revenue
Q35: The figure given below shows the revenue
Q36: The figure given below shows the revenue
Q37: The figure given below shows the revenue
Q38: The figure below shows the revenue and
Q40: The figure below shows the revenue and
Q41: The following table shows the payoff matrix
Q42: The figure given below shows the revenue
Q43: The following table shows the payoff matrix
Q44: The figure given below shows the revenue
Unlock this Answer For Free Now!
View this answer and more for free by performing one of the following actions

Scan the QR code to install the App and get 2 free unlocks

Unlock quizzes for free by uploading documents