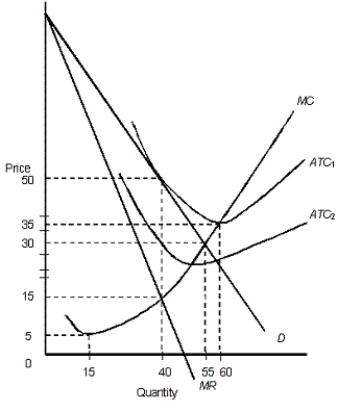
The figure below shows the revenue and cost curves of a monopolistically competitive firm.Figure: 12.2
 In the figure,
D: Demand curve
MR: Marginal revenue curve
ATC1 and ATC2: Average total cost curves
MC: Marginal cost curve
-If economic losses exist in a monopolistically competitive market,
A) new products will be introduced.
B) new firms will enter the market because they see potential for profit in the future.
C) firms will exit the market and the existing firms' demand curves will shift to the left.
D) the average total cost curve must lie below the demand curve.
E) firms will exit the market and existing firms' demand curves will shift to the right.
Correct Answer:
Verified
Q35: The figure given below shows the revenue
Q36: The figure given below shows the revenue
Q37: The figure given below shows the revenue
Q38: The figure below shows the revenue and
Q39: The figure given below shows the revenue
Q41: The following table shows the payoff matrix
Q42: The figure given below shows the revenue
Q43: The following table shows the payoff matrix
Q44: The figure given below shows the revenue
Q45: The figure given below shows the revenue
Unlock this Answer For Free Now!
View this answer and more for free by performing one of the following actions

Scan the QR code to install the App and get 2 free unlocks

Unlock quizzes for free by uploading documents