The figure given below shows the cost and revenue curves of a monopolist. Figure 10.9 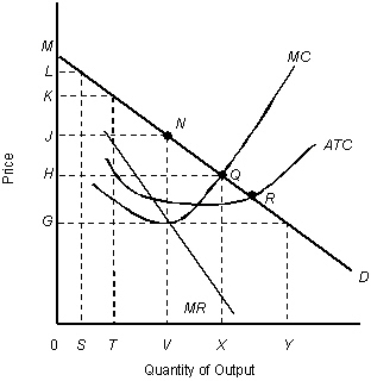 D: Average revenue
MR: Marginal revenue
ATC: Average total cost
MC: Marginal cost
-Refer to Figure 10.9.Suppose that the market is perfectly competitive.The consumer surplus would be represented by the area _____.
A) JNM
B) 0JNV
C) HMQ
D) 0HQX
E) JHQN
Correct Answer:
Verified
Q68: The figure given below shows the demand
Q79: The following table shows the marginal revenues
Q82: The following figure shows revenue and cost
Q82: The figure given below shows the cost
Q84: The figure given below shows the cost
Q87: The figure given below shows the cost
Q90: The figure given below shows the cost
Q92: The figure given below shows the cost
Q93: The figure given below shows the cost
Q96: The figure given below shows the cost
Unlock this Answer For Free Now!
View this answer and more for free by performing one of the following actions

Scan the QR code to install the App and get 2 free unlocks

Unlock quizzes for free by uploading documents