The following figure shows revenue and cost curves of a monopolist. Figure 10.8 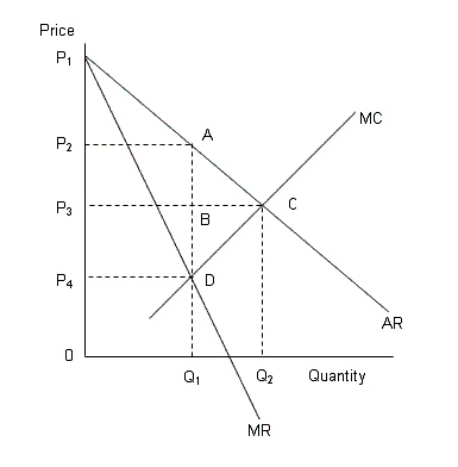
AR: Average revenue curve
MR: Marginal revenue curve
MC: Marginal cost curve
-According to Figure 10.8,the profit maximizing price of the monopolist is:
A) 0.
B) P4.
C) P3.
D) P2.
E) P1.
Correct Answer:
Verified
Q68: The figure given below shows the demand
Q77: The following figure shows the revenue curves
Q78: The figure below shows the market equilibrium
Q79: The following table shows the marginal revenues
Q84: The figure given below shows the cost
Q84: The figure given below shows the cost
Q90: The figure given below shows the cost
Q92: The figure given below shows the cost
Q93: The figure given below shows the cost
Q96: The figure given below shows the cost
Unlock this Answer For Free Now!
View this answer and more for free by performing one of the following actions

Scan the QR code to install the App and get 2 free unlocks

Unlock quizzes for free by uploading documents