The figure below shows the market equilibrium (point B) at the intersection of demand and supply curves under perfect competition. Figure 10.5 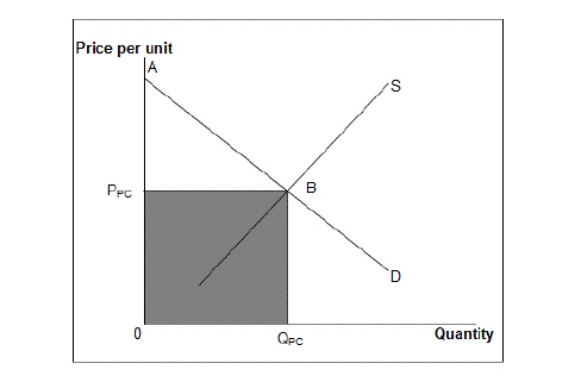
D: Market demand curve
S: Market supply curve
-Refer to Figure 10.5.Assume that the curve labeled S represents the monopolist's marginal-cost curve and the curve labeled D represents the monopolist's demand curve.Which of the following will represent the consumer surplus?
A) The area PPCBA
B) The area 0BPPC
C) The area 0BA
D) An area that is less than PPCBA
E) The area ABS
Correct Answer:
Verified
Q68: The figure given below shows the demand
Q73: Compared with a perfectly competitive market with
Q74: The figure given below shows the demand
Q75: The following figures show the demand and
Q76: The following figures show the demand and
Q77: The following figure shows the revenue curves
Q79: The following table shows the marginal revenues
Q82: The following figure shows revenue and cost
Q84: The figure given below shows the cost
Q93: The figure given below shows the cost
Unlock this Answer For Free Now!
View this answer and more for free by performing one of the following actions

Scan the QR code to install the App and get 2 free unlocks

Unlock quizzes for free by uploading documents