The figure given below shows the demand curves of two classes of buyers for tickets to a football match. Figure 10.4 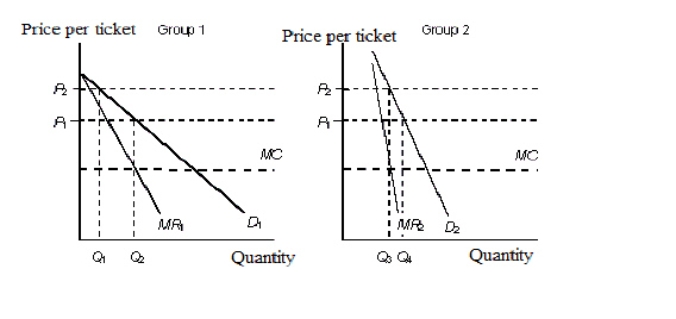
D1: Demand curve of group 1
D2: Demand curve of group 2
MR1: Marginal revenue of group 1
MR2: Marginal revenue of group 2
MC: Marginal cost
-Refer to Figure 10.4.What price must be charged to both the groups to maximize profits?
A) P1
B) P2
C) Group 1 must be charged P1 and group 2 must be charged P2.
D) Group 1 must be charged P2 and group 2 must be charged P1.
E) Both the groups must be charged a price that is equal to the marginal cost.
Correct Answer:
Verified
Q69: The following table shows the marginal revenues
Q69: The figure below shows the market equilibrium
Q70: The efficiency loss that occurs when a
Q72: The following figure shows the revenue curves
Q73: Compared with a perfectly competitive market with
Q75: The following figures show the demand and
Q76: The following figures show the demand and
Q77: The following figure shows the revenue curves
Q78: The figure below shows the market equilibrium
Q79: The following table shows the marginal revenues
Unlock this Answer For Free Now!
View this answer and more for free by performing one of the following actions

Scan the QR code to install the App and get 2 free unlocks

Unlock quizzes for free by uploading documents