The following figures show the demand and cost curves of a perfectly competitive and a monopoly firm respectively. Figure 10.7 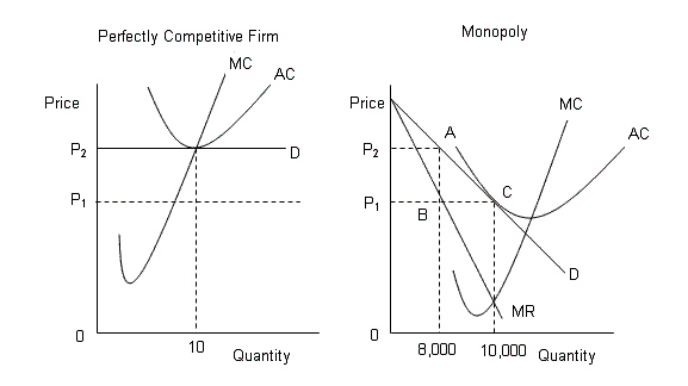
D: Average Revenue
AC: Average cost
MC: Marginal cost
MR: Marginal cost
-According to Figure 10.7,when the monopolist is maximizing profit:
A) its resources are not being used efficiently.
B) its price is higher than that charged by the perfectly competitive firm.
C) its price is equal to the price charged by the perfectly competitive firm.
D) it is earning above-normal profit.
E) it is actually incurring a loss.
Correct Answer:
Verified
Q68: The figure given below shows the demand
Q69: The following table shows the marginal revenues
Q72: The following figure shows the revenue curves
Q73: Compared with a perfectly competitive market with
Q74: The figure given below shows the demand
Q75: The following figures show the demand and
Q77: The following figure shows the revenue curves
Q78: The figure below shows the market equilibrium
Q79: The following table shows the marginal revenues
Q84: The figure given below shows the cost
Unlock this Answer For Free Now!
View this answer and more for free by performing one of the following actions

Scan the QR code to install the App and get 2 free unlocks

Unlock quizzes for free by uploading documents